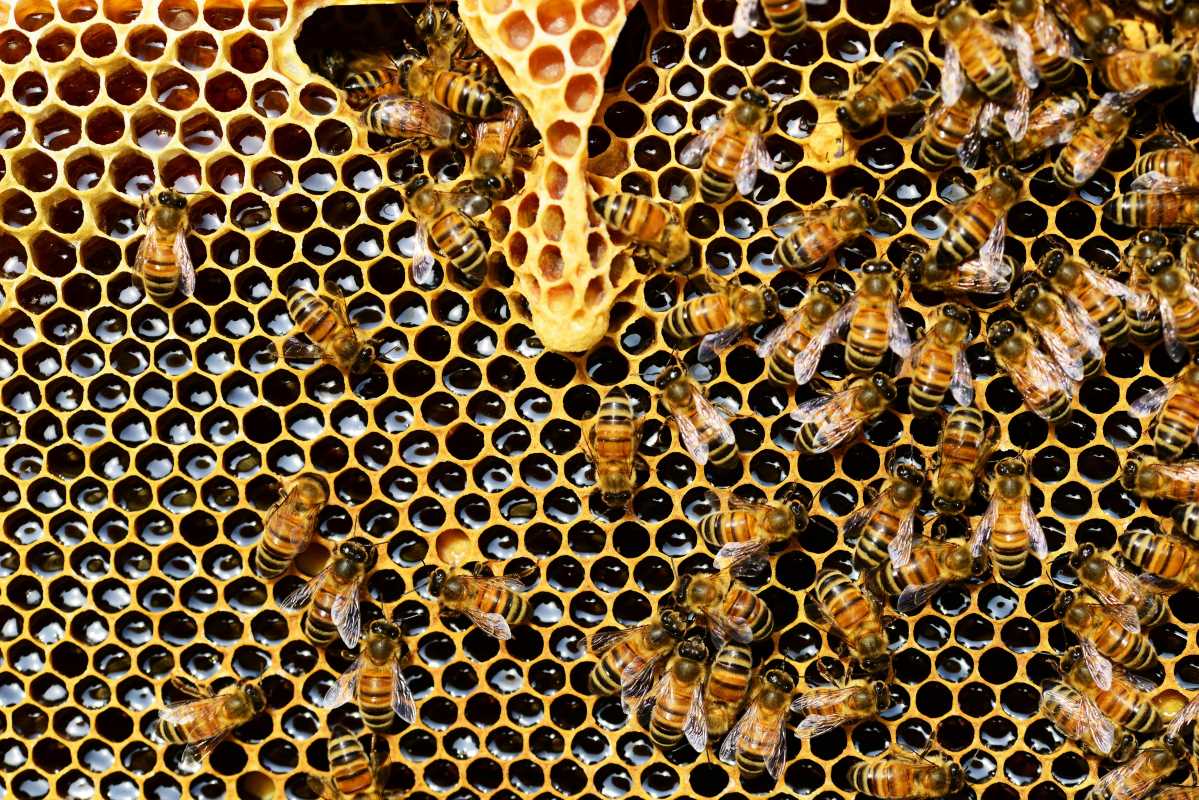
 (Image via
Wide expanses of land offer incredible opportunities to support healthy bee populations when technology and attentive care come together. By using real-time data, land managers can decide where wildflowers will flourish and modify landscapes to ensure bees have access to food for longer periods. Sensors placed inside hives monitor humidity, temperature, and weight, providing valuable insights about feeding and nectar availability. With this information, people can plan when and where to plant flowers or move hives, encouraging more effective pollen movement throughout large areas. This thoughtful combination of observation and technology transforms ordinary fields into vibrant, essential spaces for pollinators like bees.
Fresh perspectives on bee health often focus on reducing pesticide use or creating planting mixes. Sensor networks add a new layer: instant feedback. As sensors detect declining hive weight before dawn, you realize the colony needs additional forage or a new water source. When humidity rises above the ideal range, you can ventilate hive boxes or thin surrounding vegetation. Data-driven steps create a feedback loop that maintains bee populations and plant diversity in expansive outdoor settings.
Mapping Nectar Availability with Data
You can map nectar availability by combining soil moisture probes with remote weather data. Soil probes measure moisture at root depths to indicate when flowering begins. Comparing that with local rainfall forecasts provides insight into peak nectar periods. Map points across fields to identify underperforming patches. Then reseed those zones with late-bloom cultivars. This method extends the nectar season by several weeks.
Advanced mapping tools use aerial imaging and ground sensors to chart flower density and bloom stage. A drone or tethered camera captures high-resolution images. Software analyzes pixel ratios for petal coverage. Ground sensors confirm temperature and humidity at plant canopy height. Overlay datasets in a GIS platform to highlight gaps in pollen availability. Schedule planting to ensure continuous bloom across all acreage.
Research local wildflower species that thrive in different soil types and microclimates. Install moisture sensors in shaded and sunlit areas. Compare readings over several weeks to track soil temperature swings. Use this data to decide where to introduce pollinator-friendly perennials that mature at different times. As a result, you create a shifting tapestry of blossoms that sustains bees from spring through fall.
Transform idle fields into buzzing corridors by creating nectar highways. Link isolated orchards or groves with strips of flowering shrubs. Soil sensors guide irrigation timing to support those strips during dry spells. Keep records of hive weight before and after highway installation to measure impact. Positive gains confirm the value of connecting resources for foraging bees.
Steps for Setting Up Sensors and Monitoring Hives
Temperature and Humidity Probe
Purpose: Track internal hive climate to support brood development (ideal 32–35 °C and 50–70% RH).
Steps:
- Mount the probe between brood boxes, away from direct airflow.
- Connect the probe to a wireless gateway.
- Calibrate using a known temperature reference before deployment.
Cost/Metric: ~$120 per unit; updates every 10 minutes.
Insider tip: Shield the probe from direct sun to prevent inflated readings.
Hive Scale System
Purpose: Measure weight changes to understand nectar intake and starvation risk.
Steps:
- Position the scale under the hive stand on level ground.
- Zero the scale before placing the hive.
- Program the data logger to record weight hourly.
Cost/Metric: $200–$300 per scale; accuracy within ±50 g.
Insider tip: Recalibrate monthly and after heavy rain or ground settling.
Infrared Bee Counter
Purpose: Monitor flight traffic to gauge foraging intensity and colony health.
Steps:
- Mount the sensor at the entrance tunnel.
- Set the detection window to match the opening size.
- Connect to power and the data hub; verify counts during a short test period.
Cost/Metric: ~$150 per sensor; up to 500 events/min.
Insider tip: Angle the sensor slightly downward to reduce false counts from debris or petals.
Soil Moisture Logger
Purpose: Record moisture at root depth near forage strips to optimize irrigation.
Steps:
- Insert probes at 10 cm and 30 cm depths.
- Link to a solar-powered data unit.
- Program alerts for dry thresholds.
Cost/Metric: ~$80 per dual-depth probe; battery life ~6 months.
Insider tip: Place loggers in both sunlit and shaded zones to balance irrigation decisions.
Ambient Weather Station
Purpose: Capture wind, rainfall, and solar radiation to correlate environment with hive behavior.
Steps:
- Install a mast about 5 m from the hives.
- Mount the anemometer, rain gauge, and pyranometer.
- Sync the station with central monitoring software.
Cost/Metric: ~$350 for a full kit; updates every 15 minutes.
Insider tip: Keep surrounding vegetation trimmed to avoid distorted wind readings.
Setup checklist: level mounts, initial calibration, test data flow for 24 hours, then lock placements. This ensures clean baselines before relying on trends.
Turning Data into Practical Actions
Combine hive weight, flight traffic and climate data to generate daily health reports. Automated scripts identify anomalies such as sudden weight loss or low morning activity. When these occur, inspect the hive for queen issues or disease. Adjust feeding schedules or swap frames with pollen-rich comb from stronger colonies. This proactive approach keeps each hive lively and responsive to environmental changes.
Use GIS overlays of nectar mapping and hive performance. Color-code zones based on yield and hive health. Find underperforming sectors and plant or irrigate accordingly. Schedule on-ground inspections when sensors detect prolonged deviations. Targeted field visits can prevent widespread stress on colonies before you notice visible signs of decline.
Improving Habitat Conditions with Adaptive Actions
Move hive locations based on sensor feedback and bloom progression. For example, relocate hives closer to late-season wildflower strips once initial fruit trees finish flowering. This flexible approach sustains foraging pressure and prevents depletion. Record GPS points for each placement and link them with time-stamped sensor logs. Over time, patterns emerge to guide future rotations.
Set up water stations guided by hive humidity and local temperature readings. As sensors detect rising interior humidity, place shallow water dishes near hives. Add landing stones to prevent drowning. Track humidity drops after installation to verify impact. Regular water access reduces foraging stress, keeps bees active, and cools hive interiors during hot weeks.
Expand planting diversity based on pollen analysis from periodic comb sampling. Pair lab results with bloom maps to identify missing nutrients. Then seed targeted cover crops rich in those specific pollens. Monitor hive weight before and after new plantings to verify results. This cycle of measure-plant-measure improves forage quality without guesswork.
Data-driven beekeeping connects large plots into pollinator networks. Sensors guide planting, irrigation, and hive care for higher yields and healthier ecosystems.